Check out the JUCE and lldb implementation on GitHub.
What’s the problem?
I keep running into situations where I’d like to be able to “see” what my various buffers and blocks of audio look like.
Usually I want to answer one or more of the following:
- Is there a signal present?
- Is it sinusoidal?
- How many cycles are there?
- Is all or part of an audio buffer empty?
- Are there discontinuities or values out of bounds?
Ideally, I could peek at the waveform of whatever buffer I’m working with, on the fly. However, I’m not always working in a UI context. For example, I might be writing tests for an audio engine and just trying to figure out what’s even in the buffer.
One can always write a bunch of float values to the console, but humans don’t parse thousands of float values well. Have fun counting those zero crossings…
Sparklines would be pretty cool…
I’m a big Edward Tufte fan. One of the things he champions is “data-intense, design-simple, word-sized graphics” which he calls sparklines.
At a glance, they convey general characteristics about a data series. Individual data points are not relevant, only the trend is.

Sparklines in Unicode?
So, uhh… can I make sparkline graphs of my audio buffers with unicode?
Not only does unicode have block elements (▁▂▃▄▅▆▇█) but apparently there are people using these elements to make sparkline bar graphs!
However, block elements are bottom aligned instead of center aligned. So they won’t really work to display an audio waveform.
Audio Sparklines
The best solution I found was to pick 7 horizontal line symbols to represent the waveform:
_⎽⎼—⎻⎺‾Yup, we’re decimating the audio down to 3 bits.
We’ll also add the following features to the sparkline:
0 is a true 0
0(234) shows a chunk of zeros, in this case 234
x represents a zero crossing
E is out of bounds (below -1.0, above 1.0)
I = Inf (Infinity, meaning you've divided by zero)
N = NaN (undefined calculation that's not INF)
S = Subnormal detected
Here’s 2 cycles of a healthy sine wave, with every sample represented:
[0———⎻⎻⎻⎻⎻⎻⎻‾‾‾‾‾‾‾‾⎺⎺⎺⎺⎺⎺⎺⎺⎺⎺⎺⎺⎺⎺⎺⎺⎺⎺⎺⎺⎺⎺⎺⎺⎺⎺⎺⎺⎺⎺⎺⎺⎺⎺⎺⎺‾‾‾‾‾‾‾‾‾⎻⎻⎻⎻⎻⎻⎻———x——⎼⎼⎼⎼⎼⎼⎼⎽⎽⎽⎽⎽⎽⎽⎽⎽____________________________________⎽⎽⎽⎽⎽⎽⎽⎼⎼⎼⎼⎼⎼⎼————x——⎻⎻⎻⎻⎻⎻⎻‾‾‾‾‾‾‾‾⎺⎺⎺⎺⎺⎺⎺⎺⎺⎺⎺⎺⎺⎺⎺⎺⎺⎺⎺⎺⎺⎺⎺⎺⎺⎺⎺⎺⎺⎺⎺⎺⎺⎺⎺⎺‾‾‾‾‾‾‾‾‾⎻⎻⎻⎻⎻⎻⎻———x——⎼⎼⎼⎼⎼⎼⎼⎽⎽⎽⎽⎽⎽⎽⎽⎽____________________________________⎽⎽⎽⎽⎽⎽⎽⎽⎼⎼⎼⎼⎼⎼⎼———]Cool! It’s bulky and elongated, but allllllllllmost visually parseable…
Cleaning them up
To do Tufte right, we need to increase the data density. Collapsing redundant data leaves us with the “trend.” We can also add metadata to notate the scale, both in duration and amplitude.
[0⎻⎺‾⎺⎻x—⎼⎽_⎽⎼—x⎻⎺‾⎺⎻x—⎼⎽_⎽⎼—] 294 samples (-0.999 to 0.999)This is useful:
- We can visually identify 2 healthy cycles.
- We know the first value is zero.
- It looks sinusoidal
- We know there are 294 samples in total
- We know the amplitude ranges from -0.999 to 0.999.
More complex audio sparkline
Here’s an example of a block going out of audio bounds (-1.0 to 1.0).
Block is 1 channel, 1024 samples, min -1.76012, max 1.76013, 77.14% filled
[0⎻⎺⎻x—x⎻x—⎼⎽_E_⎽⎼—x⎻⎺‾E‾⎺⎻x—⎼—x⎻⎺⎻x—⎼⎽_E_⎽⎼—0⎻⎺‾E‾⎺⎻x—⎼—x⎻⎺⎻x—⎼⎽_E_⎽⎼—0(234)]- This looks sinusoidal
- We can visually see it’s going out of bounds at the positive and negative peaks. The summary tells us we are hitting values of +/- 1.76
- We see a big chunk of 234 consecutive zeros at the end of the block.
Normalizing the sparklines
To ensure visible trends on quieter segments, we can normalize before displaying.
Before normalization, a quieter signal might look like so:
Block is 1 channel, 128 samples, min -0.0951679, max 0.11609, 50.7812% filled
[—x—0(64)]
This is….cryptic and not info dense. With normalization:
Block is 1 channel, 128 samples, min -0.0951679, max 0.11609, 50.7812% filled
[‾⎺⎻—x—⎼⎽_0(64)]
Now we can see the shape of the waveform and look to the metadata for the scale.
Sparklines in Tests
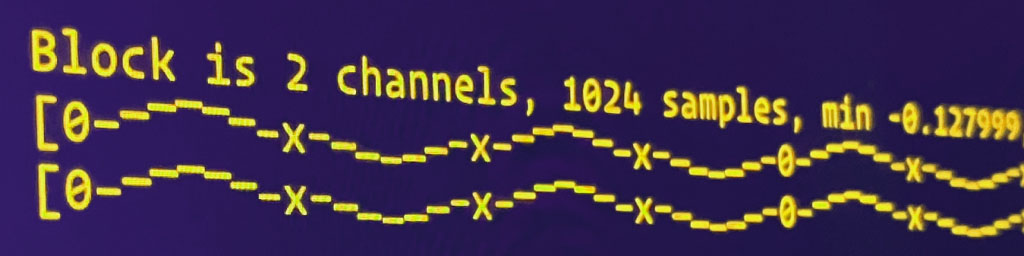
I wrote some custom Catch2 matchers to test JUCE AudioBlocks. They spit out sparklines on test failure:
REQUIRE_THAT(myAudioBlock, isEqualTo (someOtherBlock))
with expansion:

Block is 1 channel, 480 samples, min -0.766242, max 0.289615, 100% filled
[0—⎻—x—⎼⎽_⎽⎼—]
 is equal to
Block is 1 channel, 480 samples, min -1, max 1, 100% filled
[0—⎻⎺‾⎺⎻—x—⎼⎽_⎽⎼—]
Sparklines in the Debugger
The holy grail: Can we dynamically inspect blocks of audio in the debugger?
Answer. Yes. I wrote an lldb python script to summarize and display sparklines for JUCE’s AudioBlocks.
It works in any IDE with an lldb backend, such as Xcode or CLion.
A summary shows up on hover:
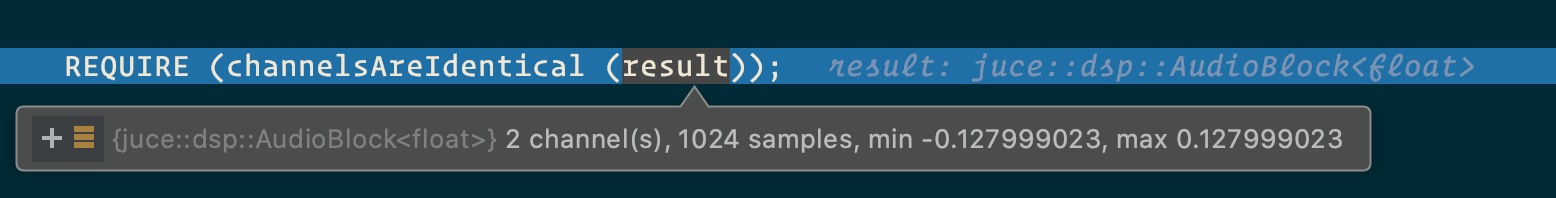
Clicking the summary shows you each channel’s sparkline and gives you access to the float values
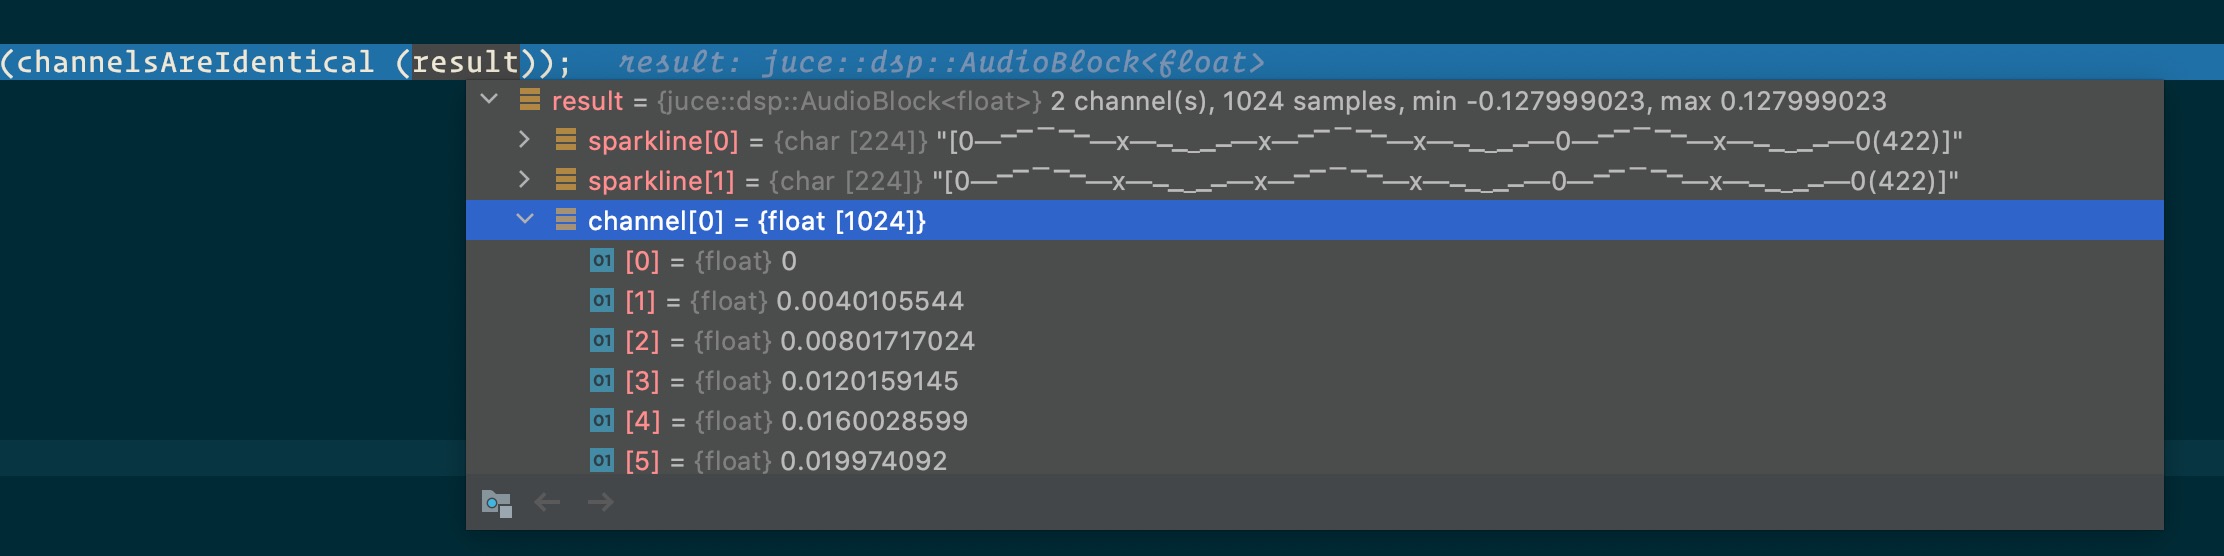
Voilà!
Check out the JUCE and lldb implementation on GitHub.
Edit: There were some comments on Hacker News and Edward Tufte tweeted about this article!
Leave a Reply