What is “jank”? It’s artifacts in your UI.
I’ve mainly heard the term used in a frontend web programming context. Ironically, most low level timing and painting is implemented for you on the web. It’s much harder to build something jank-free in a low level cross-platform C++ UI framework such as JUCE.
Examples:
I spent a week trying to get a tooltip to animate nicely in JUCE.
I spent a couple days trying to track down text rendering issue in a TextEditor.
On the main plugin I’m developing, there’s probably been a couple dozen occasions so far where I resorted to manually logging paint calls to understand why components were painting partially or “animating” strangely.
In the end, I sat down and stepped through the entire component painting process to make sure I had my fundamentals down.
What is jank?
Jank is jerky.
Jank is glitchy and flickering.
Jank is an unintentional intermediate state.
Jank is jarring and communicates “low quality” and “nobody cared.” It’s not functionally broken, but it’s certainly not nice.
Jank is my nemesis. I want to build UIs that look nice, feel snappy, and are free of papercuts.
Jank & JUCE
A C++ framework like JUCE seems more prone to jank than something like HTML/CSS:
- It’s low level enough where one has to manually manage, time and optimize paint calls
- A dev has to learn the hard way (experience or via the source) when the framework actually repaints components. For example, it’s important to know which methods (such as
setVisible) call repaint….. or that each repaint will call repaint on the component’s parent if the component is transparent, etc. - JUCE’s out of the box widgets, such as tooltips, were not built with animation in mind.
- There’s very minimal paint debugging in JUCE.
- Component animation support is ad-hoc, rather than built into the concept of a JUCE component.
- Catch22: Most audio plugin UIs are single screens, in part because it’s very high effort to make a nice cross-platform multi-screen app.
What are some examples of jank in JUCE?
Animating one component over another

I wanted a tooltip to move with a slider thumb. I discovered this was hard.
To resolve the jank (after a lot of debugging), I got clinical with paint call timing. I made sure everything was always painted synchronously (via manually calling repaint on siblings).
TextEditor painting

I had a problem where text entry felt delayed and letters appeared in pieces in two subsequent paint calls.
The root cause was because a lot of my UI was behind the modal form the TextEditor was sitting on. It turns out setOpaque wasn’t preventing those parts of the UI from painting, so lots of my UI would repaint when the cursor sang the song of its people. See the forum post.
Popups and Overlays
I’ve run into this many times. Any time a component is being placed on top of another, care has to be given to paint ordering.
Got Jank? Screen Record It
If you are seeing painting jank or glitching but can’t quite understand what’s happening, take the guesswork out of the equation: screen record what’s happening and then step through it frame by frame.
Lightweight ways I resolve jank
- Stick
DBGin paint calls of relevant children, sibling and parents. Perform relevant UI actions and check out the z order. - If you are using stock JUCE “widgets”, google their implementations for calls to
repaint, you might be surprised when things are repainting. - All sorts of things can cause a repaint, such as
setVisible,setBounds, a child’s paint call, etc. Get clear on the order. - If you are using custom UI components that you wrote, verify where you placed calls to
repaint,setVisible, etc.
Is something repainting continuously?
This can feel tough to track down, but it’s easy.
Let’s say that know (through DBG calls, etc) that something is constantly calling repaint().
What is it? You can’t stick a breakpoint in paint — paint calls originate from the OS.
To resolve, stick a breakpoint in juce_component.cpp inside Component::repaint().
Probably it’s just a timer still going when it should have been stopped.
Heavyweight ways I resolve jank
Log all component paint calls
Step 1: Open up the JUCE component implementation and stick DBG calls in Component::paintComponentAndChildren for next to each call to paint(). Note: don’t be tempted to put the DBG call into the Component::paint method, as it could be overridden.
Step 2: Demangle the component type name so you know which component is painting. I wrote a method melatonin::componentString to do this, which I include in juce_Component.cpp each time I need to do this.
Step 3: Stick something like the following into ComponentPeer‘s handlePaint method to understand what the paint bounds are for each call:
DBG("Clip bounds at handlePaint(): " + g.getClipBounds().toString())Note: this doesn’t take hierarchy into account, but it should give you a fuller picture of what’s actually painting.
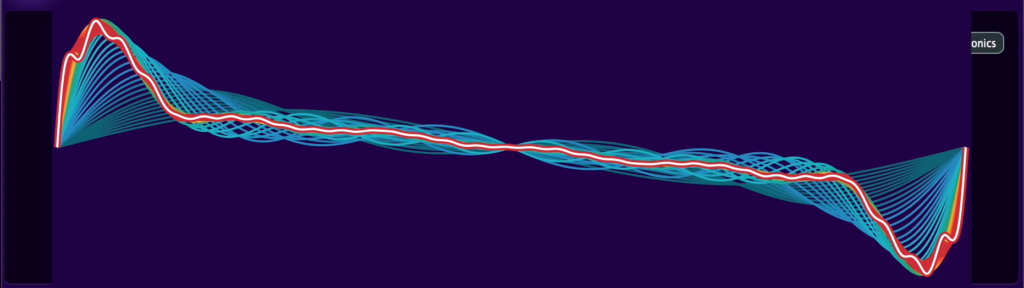
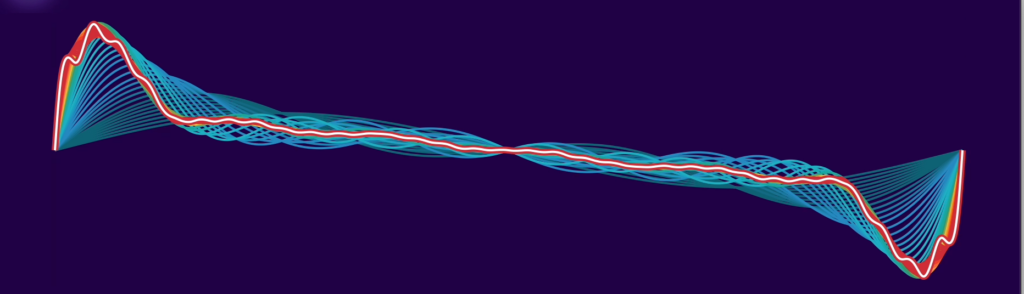
Use Perfetto
I’m a huge fan of Perfetto, the application performance tracer.
You can stick macros in the same places described above (next to the calls to paint) and get a visual hierarchy over time.
Other tools
Some people swear by “Quartz Debug” on MacOS.
You can it get by downloading “Additional Tools for Xcode” on apple’s developer site. It’s flashes paint call bounds on screen in a way people find more reliable than JUCE_ENABLE_REPAINT_DEBUGGING
Addressing Jank at the framework level
Better support for component debugging would help a lot.
JUCE_ENABLE_REPAINT_DEBUGGING visually shows you what is repainting. But it’s very hard to visually parse timing issues with flickering colors. It would be nice to have a way to debug the when and better understand how the component hierarchy is interacting.
It would be great if we could register a lambda with JUCE that is called with a reference to component on every paint call in debug. This would enable some very cool tooling (and be useful for easy console debugging).
Another improvement would be having first class animation support in the library, including implementing common easing functions, adding stack blur shadows and perhaps taking some inspiration from the greensock API. I believe this would raise the bar and better guarantee that common tasks such as popping up a modal or animating a tooltip are jank free out of the box.

Leave a Reply