Perfetto is a cross-platform application performance tracing tool I use in my C++ apps (and the JUCE framework) to investigate, inspect and optimize both dsp and UI performance.
It accurately traces different parts of your code in context, while your app is running and then allows you to visualize, explore and even SQL query the results over time.
Perfetto is the successor to chrome://tracing. Originally the trace viewer was actually a part of chrome itself (!) but is now an app available over at https://ui.perfetto.dev.
It’s also similar to OSSignPoster (thanks Dave Rowland!) which is an Apple XCode/Instruments specific tool.
I’ve created a JUCE module that wraps Perfetto which you can use with both CMake and Projucer. It’s very plug and play if you’d like to try it out.

Isn’t the profiler good enough?
When you run into a performance bottleneck, normal profiling is great for getting your bearings. It’s the best way to answer the question: “What’s the hot spot?”
However, the normal profiler samples your running app. As a result, it is very hand-wave-y. Everything is aggregated. Everything is relative. You aren’t dealing in cold hard facts like µs or ms — you are dealing with averages and percentages, and that means you have a pretty blurry picture. The profiler drunkenly points you in the right direction — and the rest is up to you.
Profiling also won’t clearly answer questions such as how frequently something is called, or in what order things are called in. These are often critical pieces of information when performance tuning.
The knowledge that a call is happening 101 times instead of 1 time is often the only piece of information you’ll need to properly resolve an issue (especially with repainting!).
What about benchmarking?
Benchmarking is a fine grained performance tool. It’s fantastic for:
- Comparing multiple implementations of an algorithm. The algorithm is usually isolated and out of context of the full running application. I perform benchmarks when researching different strategies or verifying timing for some small-but-often-called piece of code.
- Regression tests to stay aware of any breakage/slippage over time.
Benchmarking is surgically precise, but think of it this way: surgery is only useful once you already know the exact ailment. Otherwise it’s exploratory surgery, and yikes, that’s going to be a big mess.
Perfetto clears up the confusion
Perfetto is what to reach for when you want a pretty-darn-accurate picture of what’s happening in your app.
It records absolute timings on a timeline. This instantly lets you answer questions like these:
- How many µs/ms does this function call typically take?
- How often is my function being called?
- What order are things called in?
- What does the performance profile look across time?
- What’s the longest a process block ever takes (max time)?
- Is there a variant of some function call that takes excessively long?
It does this visually — allowing you to zoom in and out along a timeline — which is fantastic for exploring your application’s behavior.

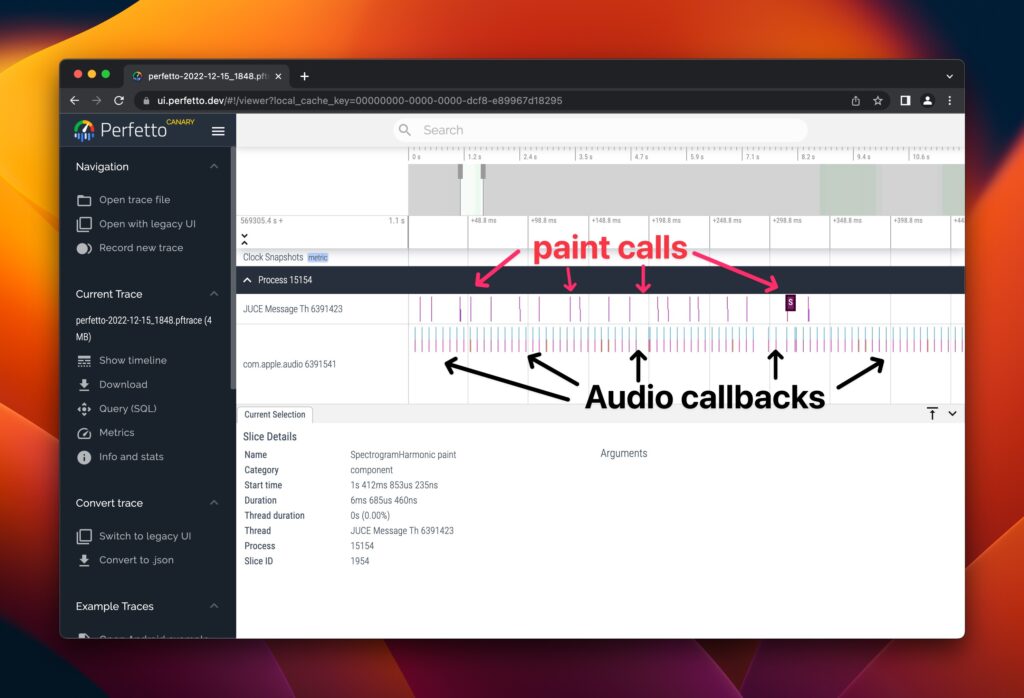
Perfect for JUCE paint calls
Why is my UI painting glitchy or sluggish?
A common issue when building UI in JUCE.
Perfetto instantly answers this question. It’s 100x better suited to this job than something like the JUCE_ENABLE_REPAINT_DEBUGGING macro.
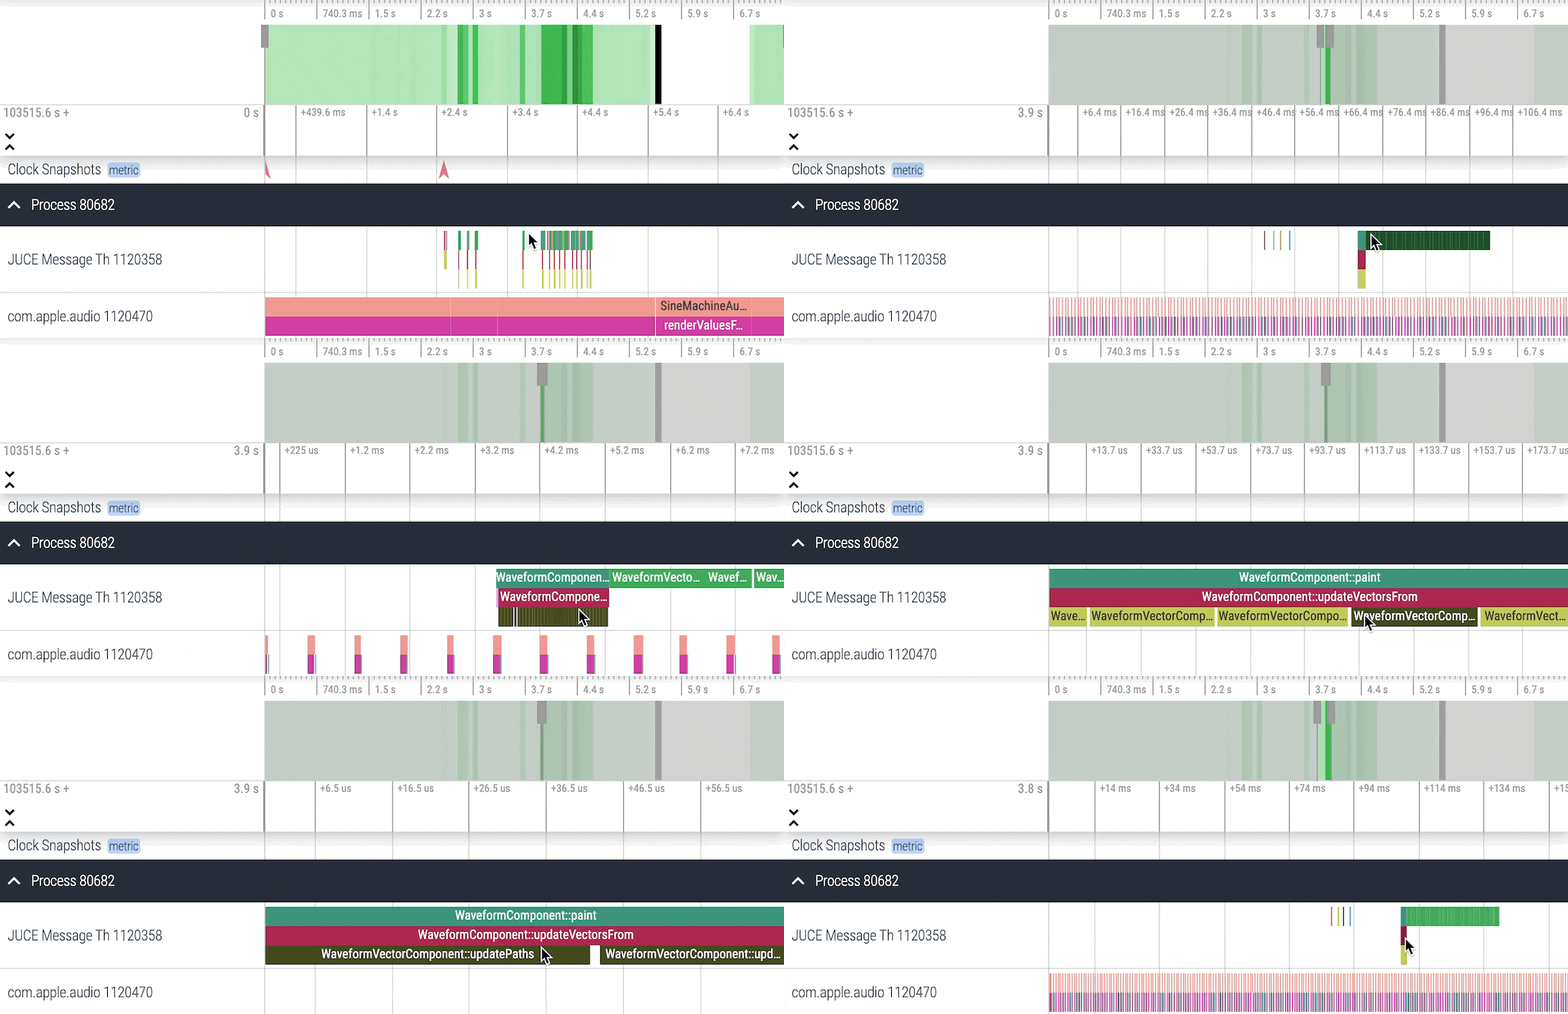
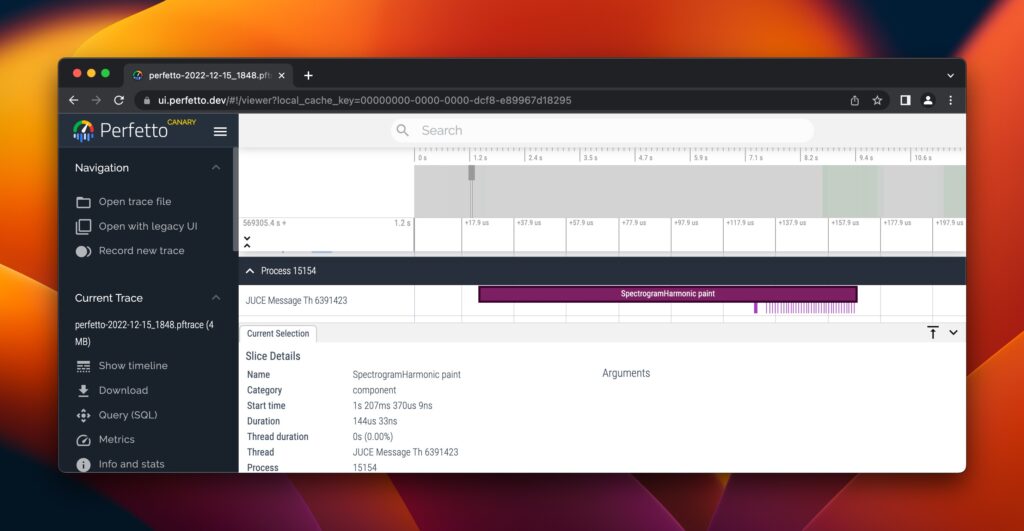
You can see how many times paint calls occur, what the timing is for each call, the timing of any child paint calls, etc.
This immediately gives you intuition around the behavior and performance profile of your app. If some paint call is taking 50ms and you are expecting a nice smooth 60fps (each paint call has must clock under ~16ms) — you know what the issue is.
If you are expecting 1 paint call and you see 50 on the timeline — you know what the issue is.

Perfect for the process block
In audio plugins, we care a lot about the audio callback from a host.
In web dev, the standard is to attend to performance at the 95th percentile. That’s because averages mask outliers: if you just looked at averages, you could have what appears to be a fast loading webpage (under 250ms) but meanwhile 20% of your users are still seeing load times of something ridiculous like 5-10 seconds.
Performance tuning for the 95th percentile ensures almost everybody is having a fantastic user experience.
In audio, we’re even more stringent. We care about the maximum amount of time taken on the shittiest hardware we support.
Since normal profiling literally presents you with averages of sampled data, it’s a terrible choice of tool for audio callback debugging. Outliers will be completely hidden.
With a callback buffer size of 32 samples at 44.1khz, we only have 0.725ms to get the audio work done. If just one audio callback happens to take longer than that amount of time — 💥 — a dropout, a glitch, a problem.
In reality, we a) probably need a good amount of headroom and b) are likely developing on a machine that’s on the higher end, so we need to account for that as well.
Perfetto shows you each audio and every callback, in sequence, over time. You can record additional data for debugging (like the number of samples in your process block). And you can easily check the max time your process block ever took.
Perfetto is a great tool for dsp. But some overhead will be incurred, so you probably don’t want to go and wrap every sample in the audio process block.
A module with support for both CMake & Projucer
I created a JUCE module for Perfetto which you can use with CMake.
Perfetto itself has some picky build needs on Windows.
On the CMake version of the module, we put in the work to abstract those gnarly build details away from you (thanks to Ben Vining for the CMake help!), so it should be very plug and play.
With some help from the community (thanks Dmytro and Stephen!) there’s now also Projucer support on both Windows and Mac. See Github for the dirty details.
Getting started with Perfetto and JUCE
To get started with Perfetto, annotate the functions you want to opt-in to the trace. Do this by peppering around macros like TRACE_DSP or TRACE_COMPONENT.
Manual annotation might sound annoying at first. But I think of it as a feature. You control the granularity and the amount of noise that shows up in your trace. You can make sure a single component’s paint is the only data being recorded. Or you can go nuts and have deep waterfalls of your dsp.
It also keeps the focus on your app. Sure, pop some calls into the JUCE framework too, if you suspect something fishy. But most of the time, performance issues are going to boil down to “you are doing something expensive too often” (like an unexpectedly large number of paint calls). Seeing framework code in there is often a distraction. It tempts you to think the framework might be the problem (when really in 99% of the cases, it’ll be your usage).
Best of all, you can leave the macros in place for next time — they are completely compiled out when Perfetto is disabled (the default).
When you do enable Perfetto and run your app, it collects the trace into a preallocated chunk of memory. It then writes out a .pftrace file on app quit.
You can take this file and pop it into https://ui.perfetto.dev and explore to your heart’s content.
Notes
Capture all paint calls
JUCE doesn’t currently contain any kind of callback on paint at the per-component level (automatically hooking into something that would be absolutely amazing for debugging and performance).
However, see this thread for some inspiration, especially Roland’s histograms!
You could also temporarily toss some code into the paintComponentAndChildren function of juce_Component.cpp.
Remember, profile Release
Just like using the normal profiler, you’ll want to be in Release mode most of the time.
I do love a well tuned Debug mode. I personally think tuning Debug is a fantastic strategy for getting Release fast fast — but that’s another blog post.
Other Tips
- The biggest “gotcha” I’ve run into: accidentally leaving Perfetto on, read more.
- Use the mouse and the WASD keys to easily navigate and zoom in the perfetto app.
- You can use spaces in event names but don’t use
#in event names or Bad Things Will Happen. - Remember, you probably don’t want to wrap every sample in it’s own trace call, that’s going to be a bit too granular and will incur too much overhead.
That’s it!
Let me know here, on the audio programmer discord, or on the JUCE forum if you are using Perfetto and have any ideas for the module.


Leave a Reply